DISTRIBUTION OF NAMES
The maps below show the distribution of the 165 Lennans and
746 Lennons in Griffiths Valuation in the middle of the
19th Century (plotted in GenMap
UK version 1.0 - I have yet to replot data in version 2.0).
Included are both county distributions and individual
locations. It will be noted that entries in Kildare (3
Lennans, 13 Lennons, 1 Lannan but no Lannons) do not appear
on the county distribution maps, due to a problem in the
programme. They do appear in the dot distribution. Both
Lenn*n variants are predominantly based in the northern and
eastern parts of the country. For bigger images, including
a key and Chapman county codes, click on the small images.
Use your browser back button to return to this page.
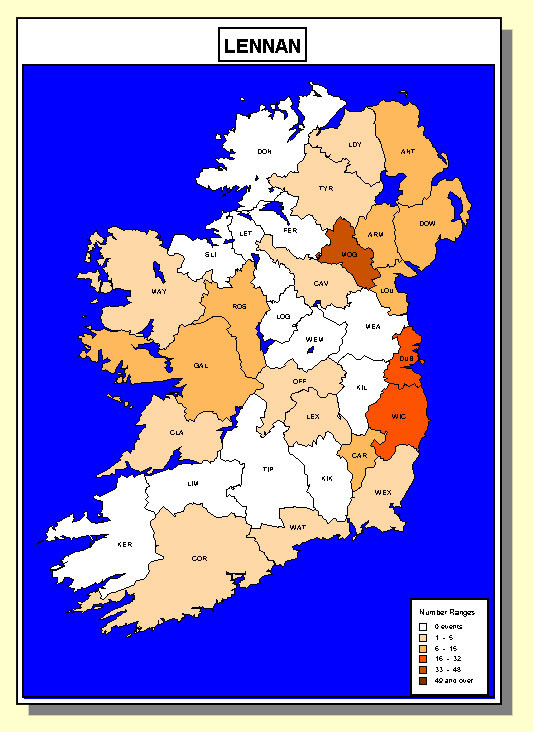
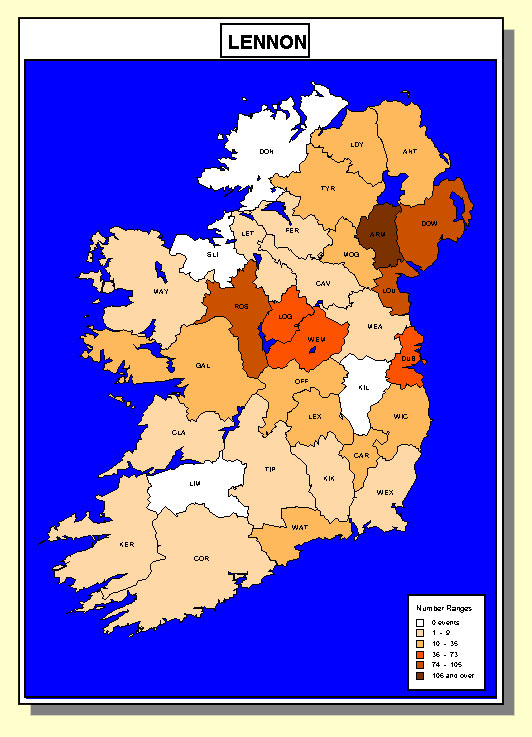
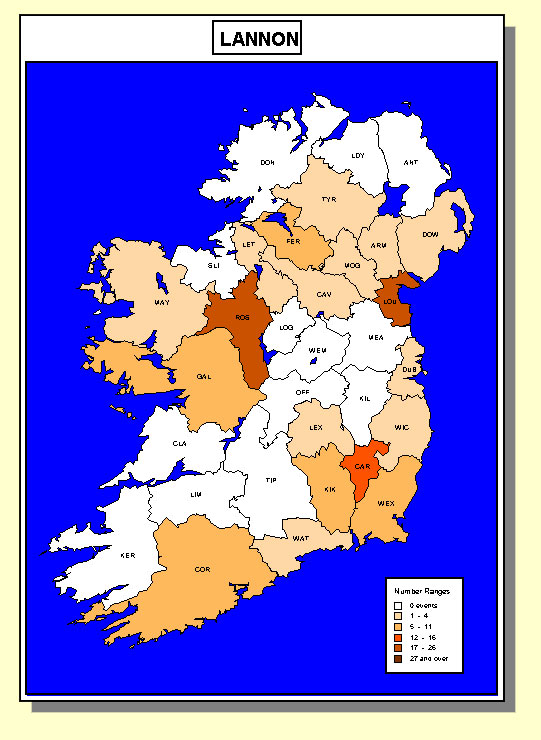
COUNTY DISTRIBUTION
The county distribution, would suggest some Lennan bias, apart from the highest distribution in Monaghan, in Dublin and Wicklow. Lennons were primarily in Armagh, with Down, Louth and Roscommon following up. Significant densities were also recorded in Longford, Westmeath and Dublin. Distribution of both names in many counties (NW to SW) was either non-existent or small.
Click back button to return to this page.
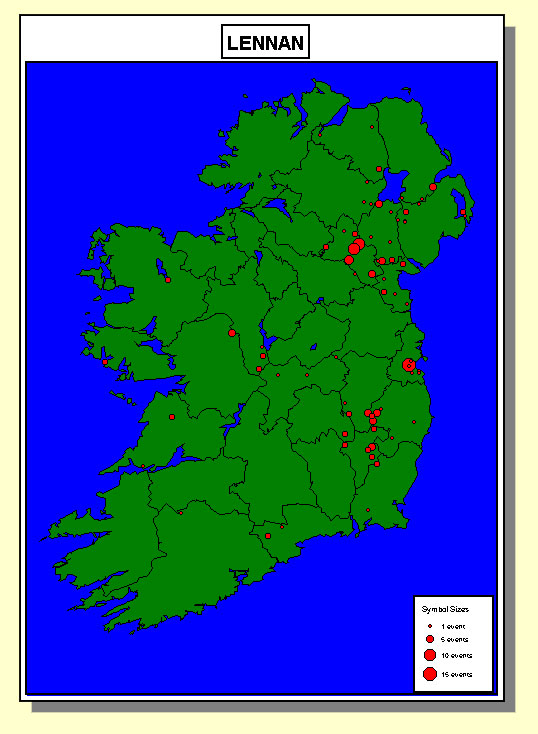
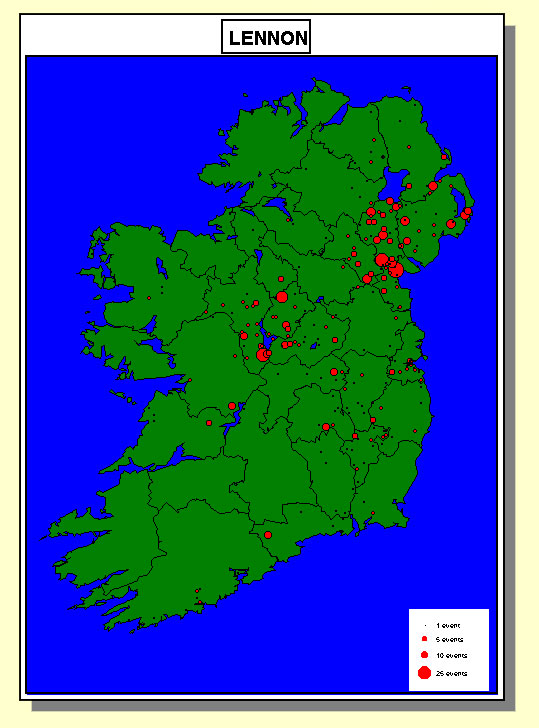
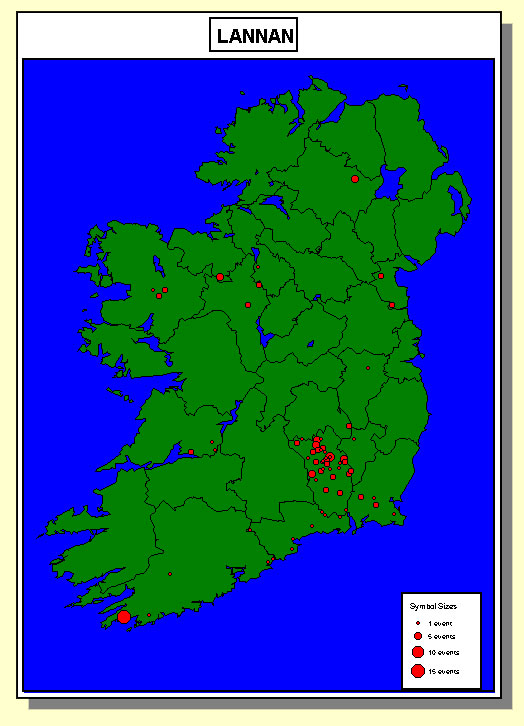
LOCATION DISTRIBUTION
The distribution, in the case of Lennan (165 entries) , would suggest a clear South Armagh, Monaghan, Louth grouping. The Antrim, Tyrone, Derry, North Armagh and Down Lennans could be part of that same group. The Wicklow Lennans would appear to belong to the Carlow, Kilkenny, and Wexford concentration, rather than that of Dublin. There would also seem to be a South Roscommon/Galway pocket. Lennons (746 entries) are more diverse. While also prevalent in similar areas, some greater concentration is recorded in the North East (particularly Down) and in the Midlands (Roscommon, Westmeath and Longford).
Click back button to return to this page.
LANN*N DISTRIBUTIONS
The Lannan (141 entries) and Lannon (109 entries) distributions, would suggest a more pronounced Western and Southern location. In the case of Lannan, Kilkenny is predominant, with Cork (around Schull) also important. Lannons are more evenly spread with concentrations in Roscommon, Louth and, to a lesser extent, Carlow.

Click back button to return to this page.

Click back button to return to this page.
OTHER DISTRIBUTIONS
A similar analysis and maps of the distribution of Glenn*ns appears on a
separate subpage, while a combined plot of Lenn*n, Lann*n
& Glenn*n, is to be found on the (G)l*nn*n Y-DNA page. The latter
illustrates significant overlapping in the Midlands and the
relative absence of observations on the Western seaboard.

 Return to Lennan home page, return to
"Lennan bits and pieces"
main page, or go to subpage Glenn*n maps.
Return to Lennan home page, return to
"Lennan bits and pieces"
main page, or go to subpage Glenn*n maps.
Or go
to data for the index to Lenn*n
entries.
![]() Alternatively, go to my
railwayana.com pages
for Irish railway data
Alternatively, go to my
railwayana.com pages
for Irish railway data ![]()
 Or even, go to my railwayana auction
price pages
Or even, go to my railwayana auction
price pages
![]()